Urban Index (UI)
Published Date: Feb. 2, 2025, 5:21 a.m. || Abin Prajapti 841 views
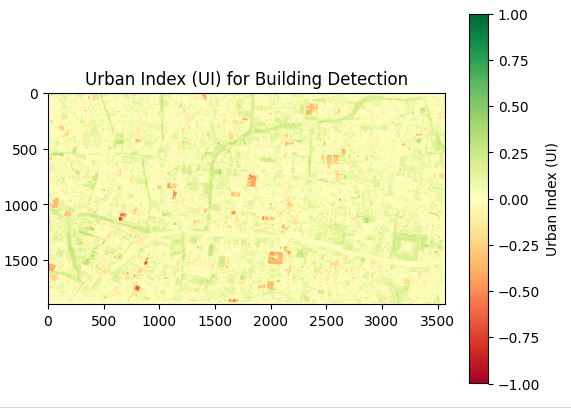
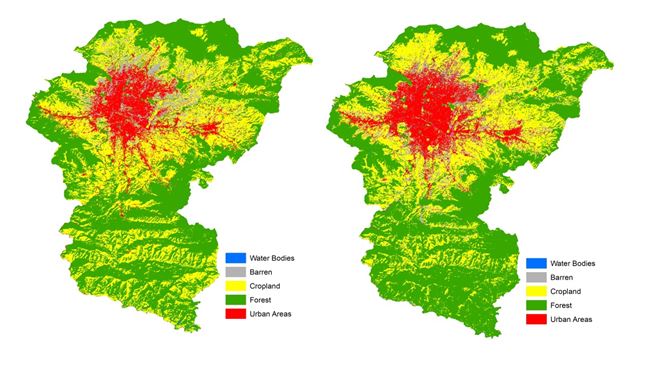
The urban index is a spectral index to detect urban and built-up areas from red and blue bands from satellite imagery. This index is mainly used for urban planning, monitoring, change detection over time, and disaster management. Urban areas reflect more in red bands than in blue bands, which indicates a higher UI value for urban areas and a lower UI value for nonurban areas.
The code for urban index is:
import rasterio
import numpy as np
import matplotlib.pyplot as psnilt
import numpy as np
import matplotlib.pyplot as psnilt
# Input and output file paths
input_path = "/kaggle/input/bkt-ortho-try/building.tif"
output_path = "/kaggle/working/urban_index.tif"
input_path = "/kaggle/input/bkt-ortho-try/building.tif"
output_path = "/kaggle/working/urban_index.tif"
# Open the RGB image file
with rasterio.open(input_path) as src:
# Read the Red and Blue bands (assuming 1=Red, 2=Green, 3=Blue)
red = src.read(1).astype(float)
blue = src.read(3).astype(float)
with rasterio.open(input_path) as src:
# Read the Red and Blue bands (assuming 1=Red, 2=Green, 3=Blue)
red = src.read(1).astype(float)
blue = src.read(3).astype(float)
# Calculate the Urban Index (UI)
urban_index = (red - blue) / (red + blue + 1e-10)
urban_index = (red - blue) / (red + blue + 1e-10)
# Create a new profile for the output raster (copy metadata from source)
profile = src.profile
profile.update(
dtype=rasterio.float32,
count=1 # Single band
)
profile = src.profile
profile.update(
dtype=rasterio.float32,
count=1 # Single band
)
# Write the output file
with rasterio.open(output_path, 'w', **profile) as ds:
ds.write(urban_index.astype(rasterio.float32), 1)
with rasterio.open(output_path, 'w', **profile) as ds:
ds.write(urban_index.astype(rasterio.float32), 1)
# Open and verify the saved file
with rasterio.open(output_path) as ds:
print("Output file saved successfully!")
print(f"CRS: {ds.crs}")
print(f"Shape: {ds.width} x {ds.height}")
print(f"Data type: {ds.dtypes[0]}")
print(f"Min: {ds.read(1).min()}, Max: {ds.read(1).max()}")
with rasterio.open(output_path) as ds:
print("Output file saved successfully!")
print(f"CRS: {ds.crs}")
print(f"Shape: {ds.width} x {ds.height}")
print(f"Data type: {ds.dtypes[0]}")
print(f"Min: {ds.read(1).min()}, Max: {ds.read(1).max()}")
# Visualize the Urban Index
plt.imshow(urban_index, cmap='RdYlGn')
plt.colorbar(label='Urban Index (UI)')
plt.title('Urban Index (UI) for Building Detection')
plt.show()
plt.imshow(urban_index, cmap='RdYlGn')
plt.colorbar(label='Urban Index (UI)')
plt.title('Urban Index (UI) for Building Detection')
plt.show()
Geospatial Category
Recent Posts