Comparison of different machine learning classifiers on urban change detection of Kathmandu valley
Published Date: Sept. 20, 2024, 5:59 a.m. || Abin Prajapti 619 views
- Methodology
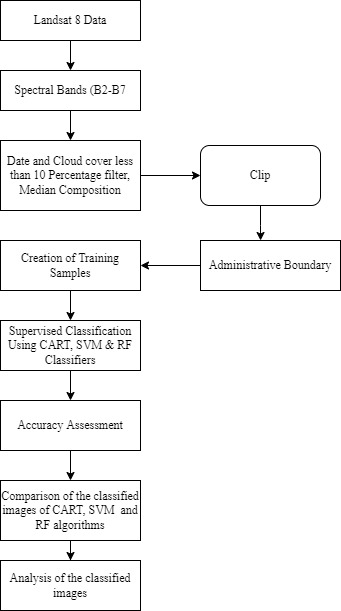
In GEE platform, first of all Landsat 8 image was imported which was then filter with the cloud percentage of less than 10. Contaminated pixels were removed from all available images due to cloudy or no-data conditions using cloud mask. To create a composite image, Landsat data from each year were combined into a single image using the median filter. Median filter assign a median value to each pixel for the entire stack of images, resulting in a single image for the entire image collection. About 600 training samples point were created. Out of which 80% were used to classify the image into five land use classes and remaining 20% were used for accuracy assessment. A confusion matrix is a created that validates and evaluates the classification accuracy of the images. Then finally image was generated in GEE which was then analyzed in arc map. Comparison and analysis of the classified image of CART, SVM and RF algorithms are done finally.
- Results
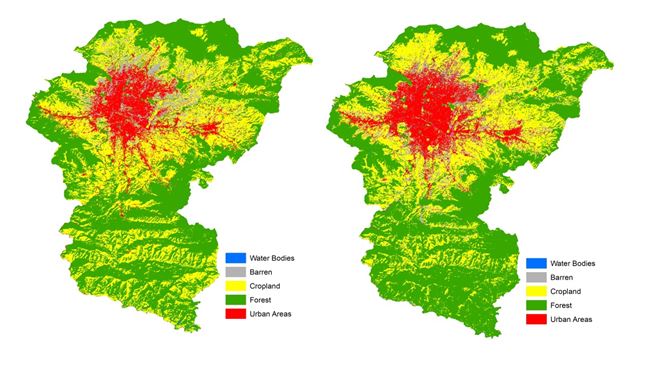
This study examines the increment in urban, barren, forest and water bodies while cropland was decreased while coming from 2013 to 2021. Comparing the Land use land cover of two decades, urban growth of Kathmandu valley was rapidly happening. Urban growth was concentric to the major road networks and the neighbor urban area of 2013.
Comparing the images of 2013 with 2021 for different machine learning classifiers, there is vast change in the urban area i.e. urban area is expanding like a balloon. Barren land has also increased in 2021 compared to 2013. Unmanaged land fragmentation increases the barren land. Croplands are degrading compared to 2013 with 2021.
- Conclusion
LULC identifies the changes in the land use of the Kathmandu valley. Crop land is degrading rapidly to resident areas and barren area. Unmanaged land pooling is transforming agricultural land to barren land. The trend of illegal parcel fragmentation for land pooling is increasing day by day. This activity is providing vitamin for urban sprawl and barren land increment. We can visualize in map that mainly urbanization is rapidly spreading over the highway and making concentric to the old urban areas.
Earthquake in Nepal in 2015 has collapsed many old houses built of soil and brick. So, earthquake affected families has built houses to the neighboring residential areas. This caused the increase of urban areas in Kathmandu valley.
Table1: Accuracy and Kappa Statistics
| Year | Classifiers | Overall Accuracy | Kappa Statistics |
|---|---|---|---|
| 2013 | CART | 0.913 | 0.872 |
| RF | 0.96 | 0.842 | |
| SVM | 0.976 | 0.965 | |
| 2021 | CART | 0.895 | 0.824 |
| RF | 0.911 | 0.85 | |
| SVM | 0.895 | 0.826 |
Table 1 represents the overall accuracy and kappa statistics of Landsat-8 images for CART, SVM and Random Forest machine learning classifiers. The overall accuracy and kappa statistics for SVM machine learning classifier is good compared to RF & CART machine learning classifiers in2013 image while the overall accuracy and kappa statistics for RF machine learning classifier is good compared to SVM & CART machine learning classifiers in2021 image.
Geospatial Category
Recent Posts