Deep Learning Based Building Footprints Extraction
Published Date: Nov. 12, 2024, 3:44 p.m. || Abin Prajapti 752 views
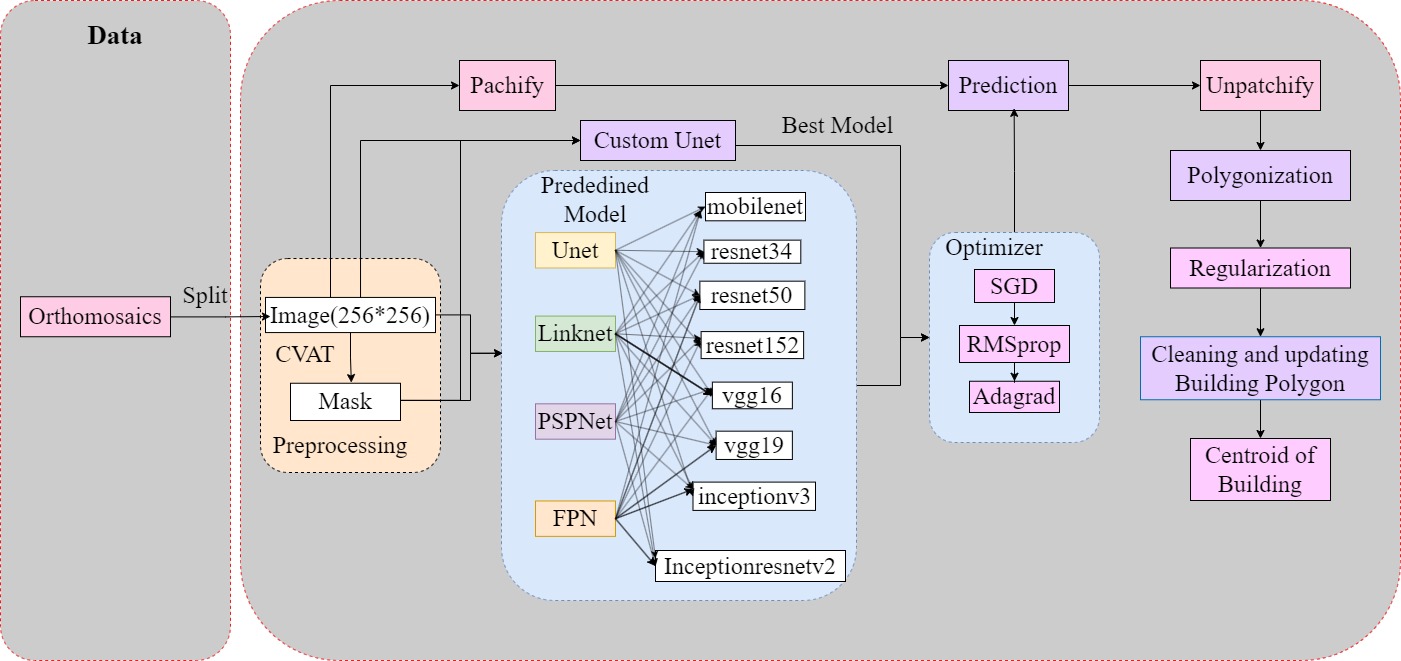
This below figure illustrates the methodology for a deep learning based footprints extraction workflow.
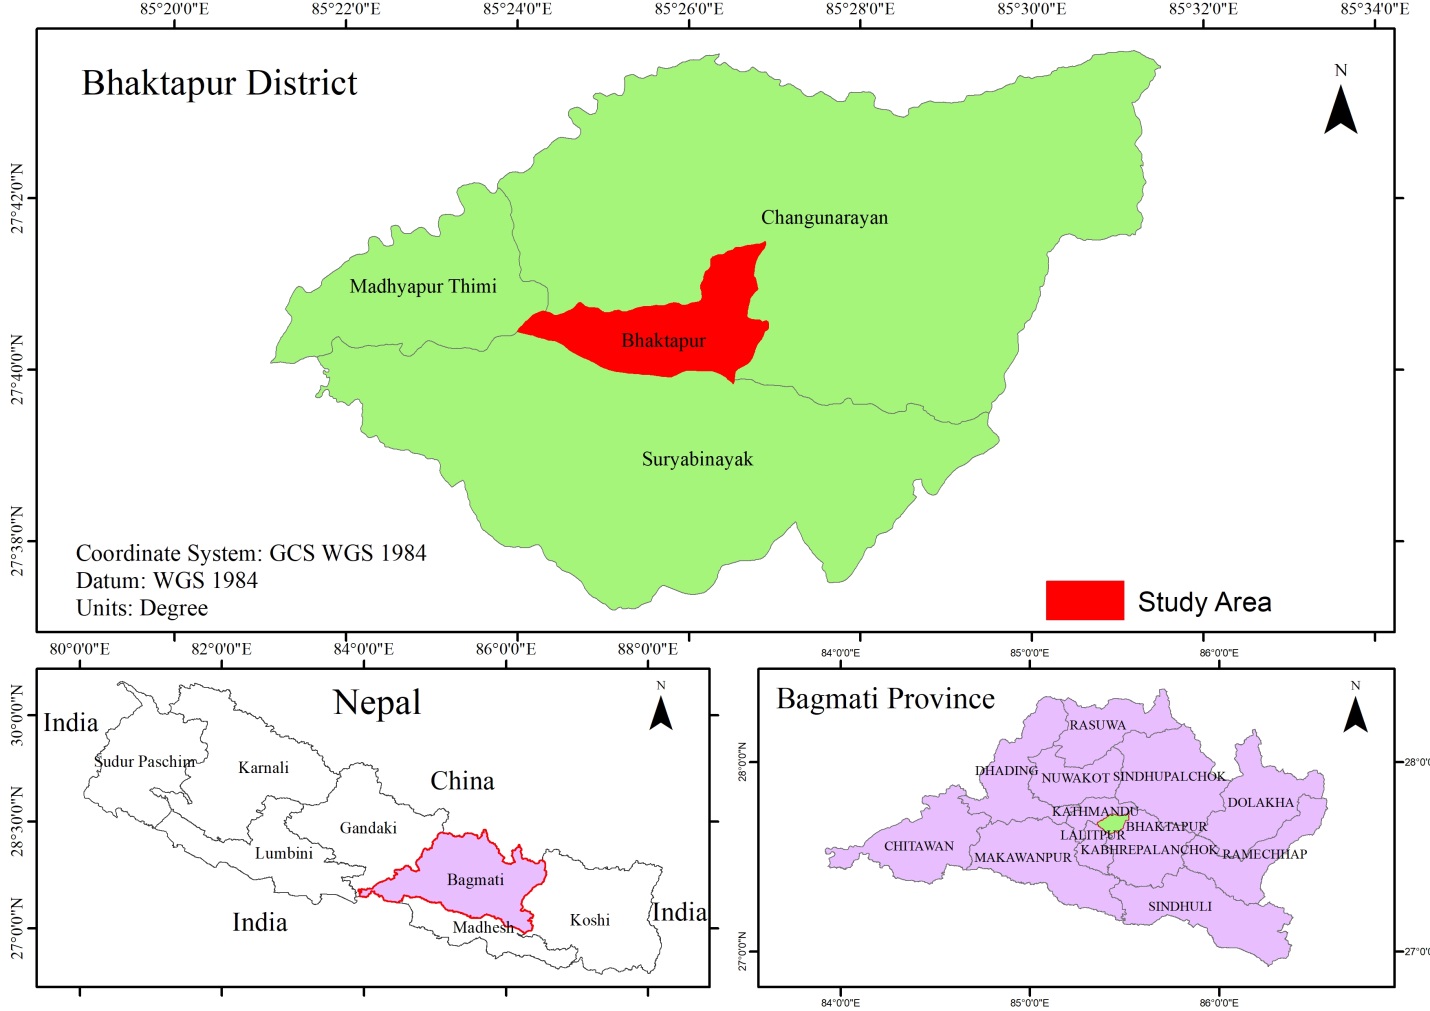
1.1 Study Area:
Bhaktapur Municipality is the oldest city of Nepal. It is smallest municipality of Nepal with an area of 6.88km2 with population density of 12,070 per km2 and lies at 1330 meters above the sea level. Geographically it extends from 27.66 ° North to 27.69 ° North and 85.399 ° East to 85.448 ° East. It is surrounded by 3 municipalities of Bhaktapur district, namely Changunarayan Municipality, Suryavinayak Municipality and Madhyapur Thimi Municipality.
Bhaktapur was the capital of ancient Nepal from 12th to 15th century. It lies in the center of Nepal in Bagmati Province. It is a "Living Museum" displaying the vibrant depth of Newari culture, heritage, tradition and Architect. About 74% of Newar caste people are residing here in Bhaktapur Municipality as per the census 2021. Majority of the people in the Bhaktapur Municipality are Hindus.
1.2 Data Acquisition:
Data from different sources were collected as per the requirement. Orthomosaics of Bhaktapur Municipality with accuracy of 2cm and Thimi Municipality with accuracy of 10cm were collected from municipalities.
1.3 Hardware/Software:
1.3.1 Google Colab Pro+:
Google Colaboratory Pro+ is a cloud based Jupyter Notebook subscription service(US$ 49.99 per month) offered by Google Colab well suited to machine learning, data science and education. It is integrated with the Google services environment such as Google Cloud Service (GCS), Google Drive and others. It provides CPU processing, powerful Graphical Processing Unit (GPU) and Tensor Processing Unit (TPU) which can speed up the training of machine learning and deep learning models for large datasets and complex models.
In this research work, Google Colab Pro + Platform is used for creating and training the model using GPU and for predicting the building footprints of the orthomosaic by patchifying the bigger orthomosaic to 256 by 256 pixel and unpatchifying all the predicted image for one bigger predicted image.
1.3.2 Python:
Python, created by Guido van Rossum in 1991, is a high level interpreted, object-oriented programming language with dynamic semantics known for its simplicity, readability and versatility. Python support packages and modules like pandas, numpy, geopandas, os and etc. which encourage program modularity and code reuse.
In this study, Python programming language with different python packages like OpenCV, numpy, matplotlib, pandas, PIL and Tensorflow are used for data cleaning, exploration, visualization and creating the model and training it with the dataset for the prediction of the building footprints from the orthomosaics generated using photogrammetry techniques.
1.3.3 Tensorflow:
Tensorflow is an end to end open source platform for machine learning and deep learning algorithms on data developed by Google. It is a tool known for its capabilities like flexibility, deep learning, large community and resources, and scalability. It offers a variety of different toolkits that helps developing models at preferred level of complexity. Lower-level APIs can be used to construct models by defining a sequence of mathematical operations and higher level APIs for specifying the predefined architectures such as linear regression or neural networks (Senousy et al., 2018). Tensorflow provides a distributed execution engine which hides the complexities of different devices (CPUs, GPUs and TPUs) ensuring everything runs smoothly and also provides a high performance core written in C++ (Senousy et al., 2018).
1.3.4 Arcgis Pro:
Arcgis pro is desktop GIS software developed by ESRI. It is a full-featured professional desktop GIS application. It is designed to facilitate the creation, analysis, visualization and management of spatial data; perform a spatial analysis, data visualization, cartographic design, collaboration and Sharing and Geoprocessing and Automation.
This software was used for spatial data handling, creating database of house and road, generate house id using the locate features along the route tool. Study area was also created using this software.
1.3.5 Computer Vision Annotation Tool (CVAT):
CVAT is a free, open source digital image annotation tool written in Python and JavaScript for computer vision such as Image classification, Object detection, Object Tracking, Image Segmentation, Pose Estimation developed by Intel which support multiple annotation formats like YOLO, Pascal VOC and MS COCO.
In this study, CVAT is used for annotating segmentation masks of 1544 images.
1.4 Data Preparation:
In this part, preprocessing of the dataset to match our model architectures was done.
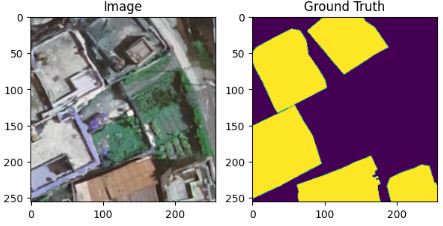
Building structure and patterns of Bhaktapur and Thimi Municipality are identical to each other. Both areas have dense urban cluster of Newar Communities. Orthomosaics of thimi was used for training dataset which makes the best training set to predict for the building of bhaktapur municipality. Orthomosaics of Thimi were splitted into 256 by 256 image size and annotation of the mask were done using CVAT annotation tool. From these splitted images using CVAT cloud platform, Ground truths were generated for 1544 images. In figure 11, Masking images are represented as yellow for buildings and blue for background. In preprocessing, masking image means binary image that is created by assigning a value of 1 to the building and 0 to the background. Out of the total annotated image, 70% were used for training, 15% for testing and 15% for validating the model.
1.5 Model
Different pre trained model and custom Unet was used on this research. Firstly, adam optimizer was used for all models and the best model having higher performance in terms of IoU Score was selected for tuning with the different optimizers like Adagrad, RMSpro and SDG.
1.5.1 Custom Unet:
Unet model architecture in tensorflow's keras was created for semantic segmentation. Image size of 256 with channels of 3 was used as input. In encoder part, a series of convolutional layers was followed by relu activation function for non-linearity and complex representations, same padding for same dimensions of the input and output feature maps and he normal kernel initializer for weight initialization to prevent vanishing gradients before and after Dropout function which helps to prevent over fitting. Then, max-Pooling layers was used to down sample the feature maps reducing the spatial dimensions by half in both height and weight after each convolutional block using the pooling window of (2,2).
In decoder part, a series of up sampling layers for increasing the spatial dimensions of the feature maps was followed by convolutional layers with relu activation function, same padding and he normal initializer. Concatenate function was used for the feature maps from the encoder and the corresponding feature maps from the decoder to recover spatial information lost during down sampling. Sigmoid activation was used in the output convolutional layer for binary segmentation mask. Model was compiled using Adam optimizer, binary cross-entropy loss function and IoU and F1 Score evaluation metrics. Model was trained using fit function with training data set on 34 steps per epoch for 100 epochs. Then the prediction of the random test image was done using the predict function for the test image after which the predicted mask was thresholded for the values greater than 0.5.
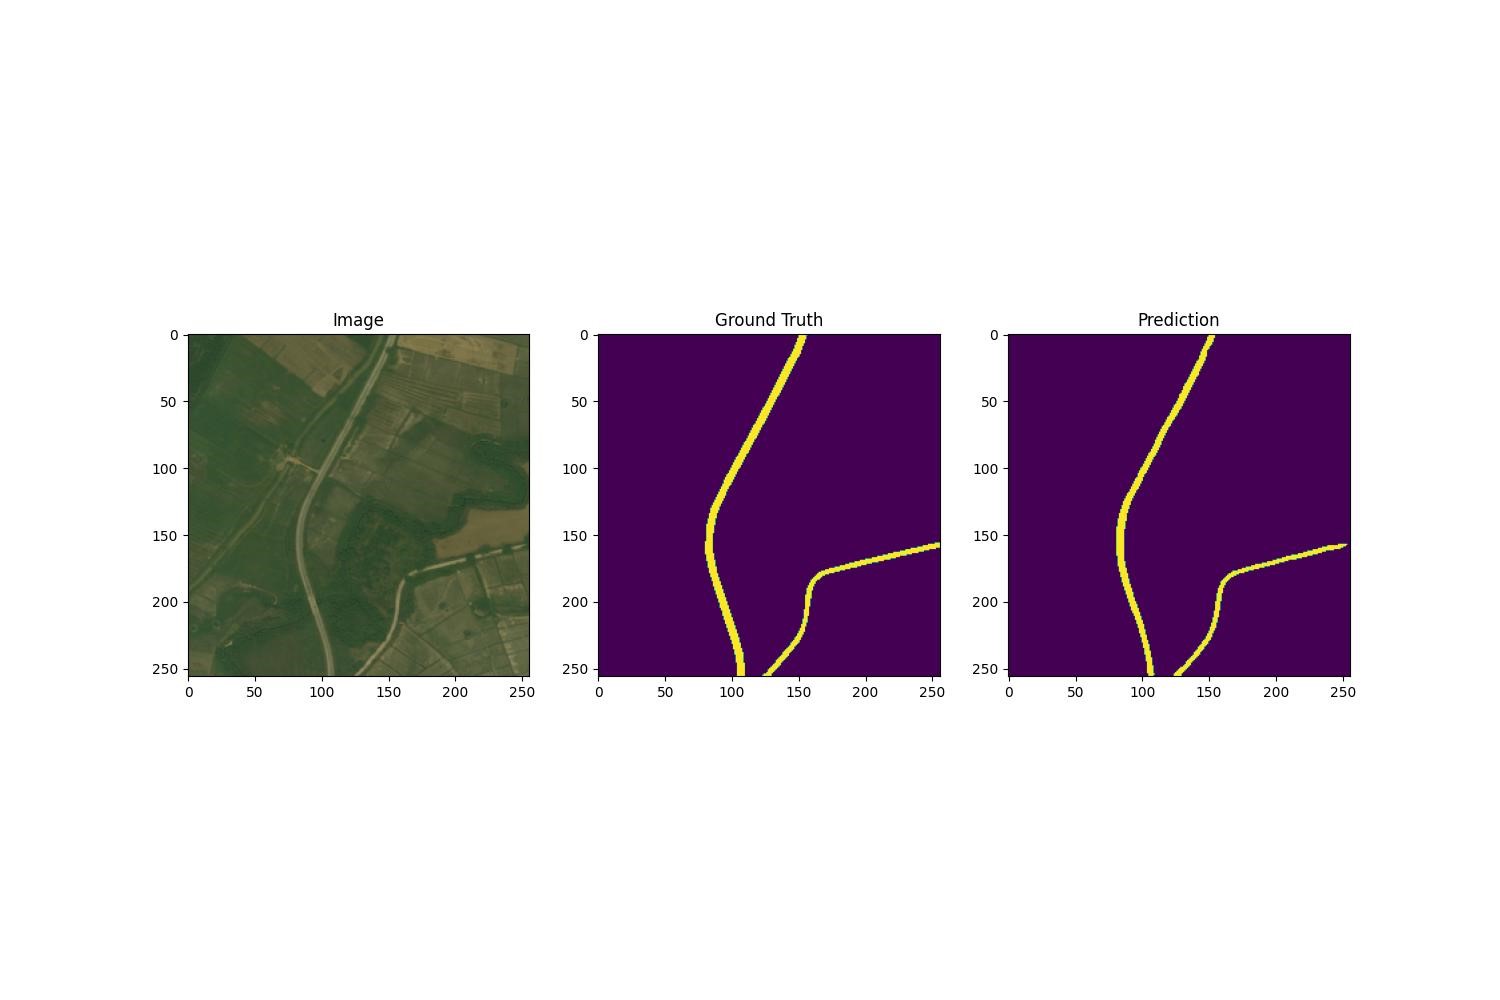
Finally the visualization of the real image, corresponding ground truth and predicted image was done to check the difference between ground truth and predicted image. Performance of the models in terms of IoU and F1 Score were analyzed and then validation and testing were done from the dataset splitted for validation and testing dataset respectively.
Hyperparameters used for Custom Unet:
Batch size: 32
Epochs-100
Activation- 'relu'
Dropout-0.1
Activation-'sigmoid' (Output)
Optimizer- 'adam'
Loss:'binary_cross_entropy"
Performance Metrics: IoU Score and F1 Score
1.5.2 Pre-trained Model:
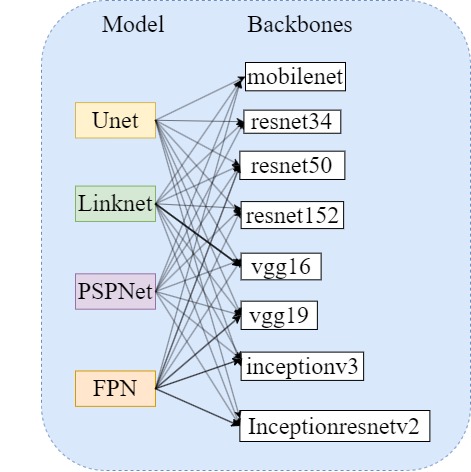
Segmentation models based on keras framework for Image Segmentation by qubvel with backbones having pre-trained encoder weights of imagenet was used for the experiment. Unet, FPN, Linknet and PSPNet model with vgg16, vgg19, resnet34, resnet50, resnet152, mobilenet, inceptionv3 and inceptionresnetv2 as the backbone were used for binary image segmentation. Backbone was used as feature extractor to build segmentation model.
Firstly, sigmoid as activation function (logistic function) was used which takes real value as input and outputs a value in the range (0, 1). Binary cross entropy as loss function measures the dissimilarity between two probability distributions of the true and predicted distribution, adam optimizer which uses the past gradients to modify the learning rate at 0.0001 for each parameter individually and separates the first and second moments of the gradients to compute adaptive learning rates for every parameter and imagenet as encoder weights which contains a large and diverse dataset improving the training efficiency were used during the model creation. IoU, loss function and F1 Score metrics were used to check the performance of the model. Then validation and testing were done from the dataset splitted for validation and testing dataset respectively.
Hyperparameters for Pretrained Model:
Batch size: 32
Epochs-100
Activation- 'sigmoid'
Optimizer- 'adam'
Learning rate- 0.0001
Loss:'binary_crossentropy"
Performance metrics: IoU Score and F1 Score
1.6 Model Tuning with Optimizers:
The best model with Adam optimizers i.e. pretrained model Unet with resnet152 was again tuned with different optimizers like SGD, RMSprop and Adagrad with learning rate of 0.0001. Optimizers play a crucial role in model training and tuning for which the models weights are updated to minimize the loss function.
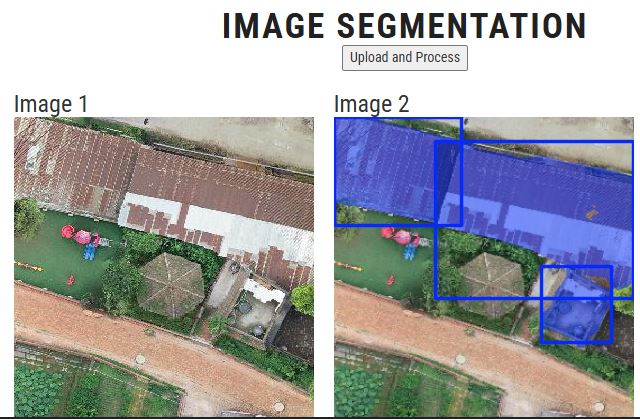
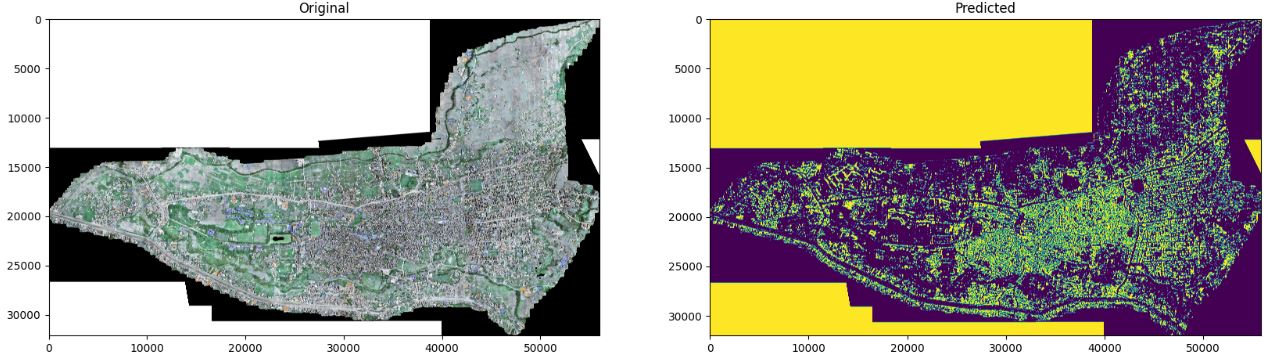
1.7 Prediction:
The best model tuned with different optimizer was used for the prediction of the building footprints of Bhaktapur Municipality. For the prediction of the bigger orthomosaics of Bhaktapur Municipaity having a size of (32102, 56024, 3), the best model Unet with resnet152 as backbone was used with RMSprop optimizer. Size of the orthomosaics was very large which couldn’t be performed with limited processing unit. So, patchify of the bigger image was done at a size of 256 with no overlapping of the images. These patched images were used for the prediction and then the predicted images were merged to a single mask image.
Below figure represents the predicted image of Bhaktapur Municipality.
1.8 Polygonization:
Predicted raster mask was then converted to vector polygon (building outlines) using Raster to Polygon Tool in Arcgis pro software.
1.9 Regularization:
Converted polygon was irregular in shape. So, douglas-peucker algorithm was used to regularize the polygon. After regularization process, polygons were better in shape.
1.10 Clean and Update of Polygon:
Finally cleaning and update of the building polygon was done. Prediction of the small hut was also done which seems to be an error for being a building. These building polygons were removed to keep the building data only. Also, some of the buildings were predicted as a single building. Those were splitted to multiple building with reference to the orthomosaic manually.
1.11 Building Footprints Extraction Experiments and Results:
This part includes the results of the building footprints extraction experiment for 100 epochs with batchsize of 32 and sigmoid activation for adam optimizers at learning rate of 0.0001. for both training and validation.
Below table presents the IoU score and F1 score of Training and Validation with Adam Optimize
|
Model |
IoU Score-Training |
F1Score-Training |
IoU Score-Validation |
F1Score-Validation |
|
Unet-Mobilenet |
0.9680 |
0.9837 |
0.3578 |
0.5263 |
|
Unet-Resnet34 |
0.9667 |
0.9831 |
0.8206 |
0.9014 |
|
Unet-Resnet50 |
0.9735 |
0.9866 |
0.8254 |
0.9042 |
|
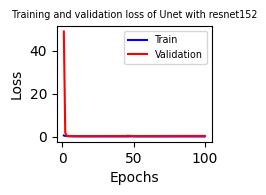
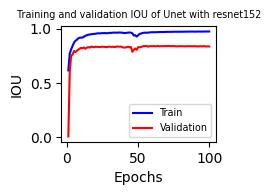
Unet-Resnet152 |
0.9744 |
0.987 |
0.8359 |
0.9104 |
|
Unet-Vgg16 |
0.9724 |
0.9860 |
0.3822 |
0.5523 |
|
Unet-Vgg19 |
0.9709 |
0.9852 |
0.3503 |
0.5183 |
|
Unet-Inceptionv3 |
0.9729 |
0.9862 |
0.3300 |
0.4951 |
|
Unet-Inceptionresnetv2 |
0.9739 |
0.9868 |
0.0104 |
0.0206 |
|
Linknet-Mobilenet |
0.9635 |
0.9814 |
0.3735 |
0.5432 |
|
Linknet -Resnet34 |
0.9684 |
0.9840 |
0.8161 |
0.8986 |
|
Linknet -Resnet50 |
0.9696 |
0.9845 |
0.8183 |
0.8999 |
|
Linknet -Resnet152 |
0.9707 |
0.9851 |
0.8366 |
0.9109 |
|
Linknet -Vgg16 |
0.9673 |
0.9834 |
0.2858 |
0.4440 |
|
Linknet -Vgg19 |
0.9660 |
0.9827 |
0.3753 |
0.5453 |
|
Linknet -Inceptionv3 |
0.9697 |
0.9846 |
0.3297 |
0.4947 |
|
Linknet -Inceptionresnetv2 |
0.9706 |
0.9851 |
0.0001 |
0.001 |
|
FPN-Mobilenet |
0.9696 |
0.9845 |
0.3589 |
0.5274 |
|
FPN -Resnet34 |
0.9717 |
0.9856 |
0.8186 |
0.9002 |
|
FPN -Resnet50 |
0.9742 |
0.9869 |
0.8155 |
0.8983 |
|
FPN -Resnet152 |
0.9750 |
0.9874 |
0.8308 |
0.9075 |
|
FPN -Vgg16 |
0.9766 |
0.9882 |
0.6701 |
0.8021 |
|
FPN -Vgg19 |
0.9735 |
0.9866 |
0.5237 |
0.6860 |
|
FPN -Inceptionv3 |
0.9743 |
0.9870 |
0.3302 |
0.4953 |
|
FPN -Inceptionresnetv2 |
0.9696 |
0.9846 |
0.3615 |
0.5302 |
|
PSPNet-Mobilenet |
0.9274 |
0.9623 |
0.3326 |
0.4979 |
|
PSPNet -Resnet34 |
0.9608 |
0.9800 |
0.7946 |
0.8854 |
|
PSPNet -Resnet50 |
0.9624 |
0.9808 |
0.7963 |
0.8865 |
|
PSPNet -Resnet152 |
0.9662 |
0.9828 |
0.8048 |
0.8918 |
|
PSPNet -Vgg16 |
0.9732 |
0.9864 |
0.5599 |
0.7172 |
|
PSPNet -Vgg19 |
0.9688 |
0.9841 |
0.4672 |
0.6366 |
|
PSPNet -Inceptionv3 |
0.9522 |
0.9755 |
0.068 |
0.068 |
|
PSPNet -Inceptionresnetv2 |
0.9561 |
0.9775 |
0.015 |
0.030 |
|
Unet |
0.8948 |
0.9623 |
0.7284 |
0.8601 |

Below table represents IoU Score and F1 score of training and validation with different optimizer.
|
Optimizer |
IoU Score-Training |
F1Score-Training |
IoU Score-Validation |
F1Score-Validation |
|
SGD |
0.2618 |
0.4147 |
0.2486 |
0.3980 |
|
RMSprop |
0.9786 |
0.9892 |
0.8408 |
0.9134 |
|
Adagrad |
0.5913 |
0.7326 |
0.5390 |
0.7000 |


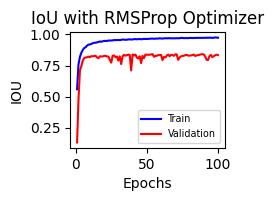
Unet with Resnet 152 model having the highest IoU and F1 score was tuned with different optimizers like SDG, RMSprop and Adagrad. RMSprop optimizer has higher IoU and F1 Score than adam which was shown in table 4. Other two optimizers SGD and Adagrad have lower performance in terms of IoU and F1 Score than adam. RMSprop optimizer outperforms all other optimizer. Then the higher IoU and F1 Score with lower loss function was used for the prediction of the buildings of the orthomosaics of Bhaktapur Municipality.
Geospatial Category
Recent Posts